Canvas text measured and drawn like the reference browser, and SVG shapes you can measure
Charts drawn on a canvas size their labels with measureText, and Floati answered with a rough guess of half a character's height per letter. It now measures with the same fonts it paints with, so widths match the reference browser to the hundredth of a pixel, and bold and italic canvas text really is bold and italic. SVG gains its geometry: bounding boxes, transform matrices, path lengths, points along a path and hit tests, checked on 1,740 generated cases every build.
Canvas charts that fit their labels
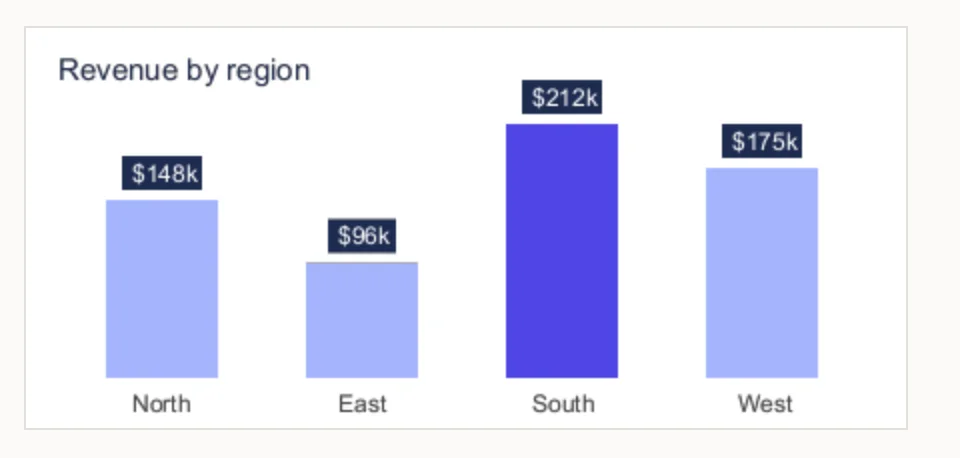
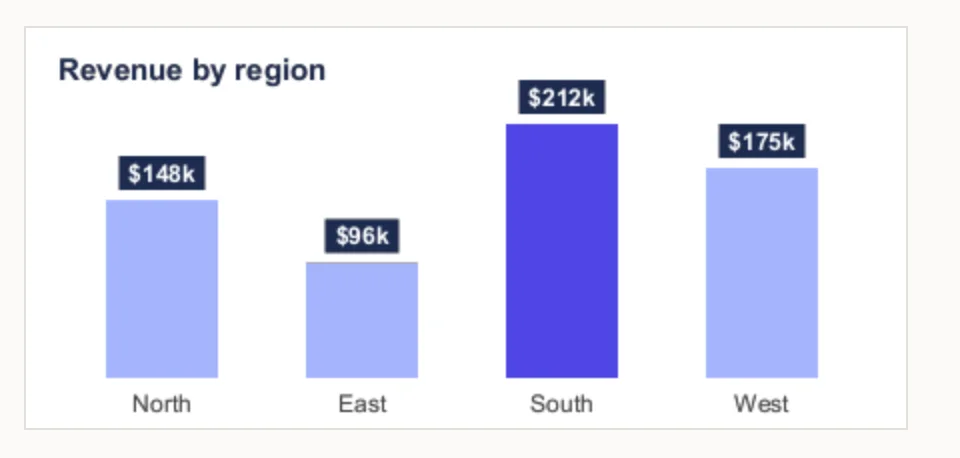
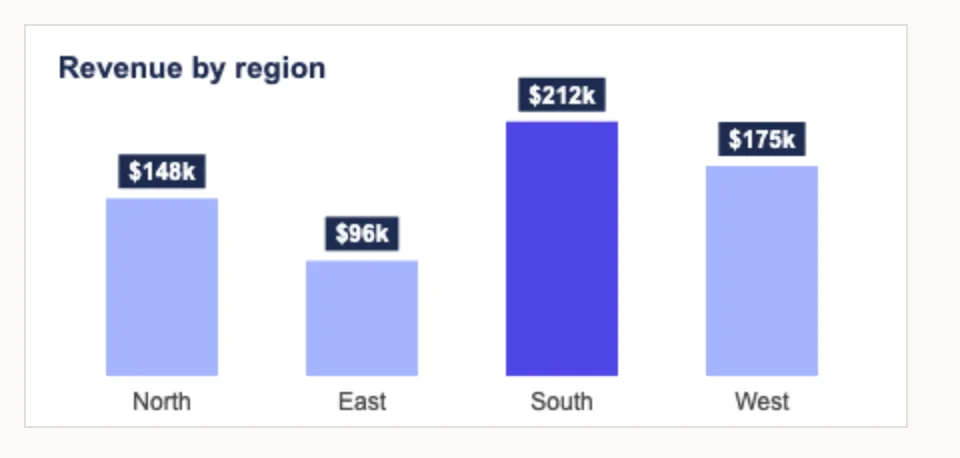
This is a canvas chart laid out the way Chart.js and most canvas chart kits do it: each value badge is sized to its text with measureText, and the title and badges are bold. Floati guessed text widths and drew bold text in the regular face, so badges came out the wrong size and nothing was bold. It now measures and draws with the real faces, bold and italic included, and matches the reference browser.
SVG shapes you can measure
Diagram editors, map widgets and animated line drawings ask SVG where things are: a shape's bounding box, the matrix that places it on screen, how long a path is and where a point along it falls. These now all work, matching the reference browser on 16 of 17 checks. On the 17th Floati is more exact than the reference browser: the reference browser measures circles and arcs with a coarse approximation and reads a circle of radius 10 as 62.43 long instead of 2 pi r, 62.83.
What changed 6 changes
Try it in your browser
Each check runs live in the browser you are reading with. Nothing is sent anywhere.